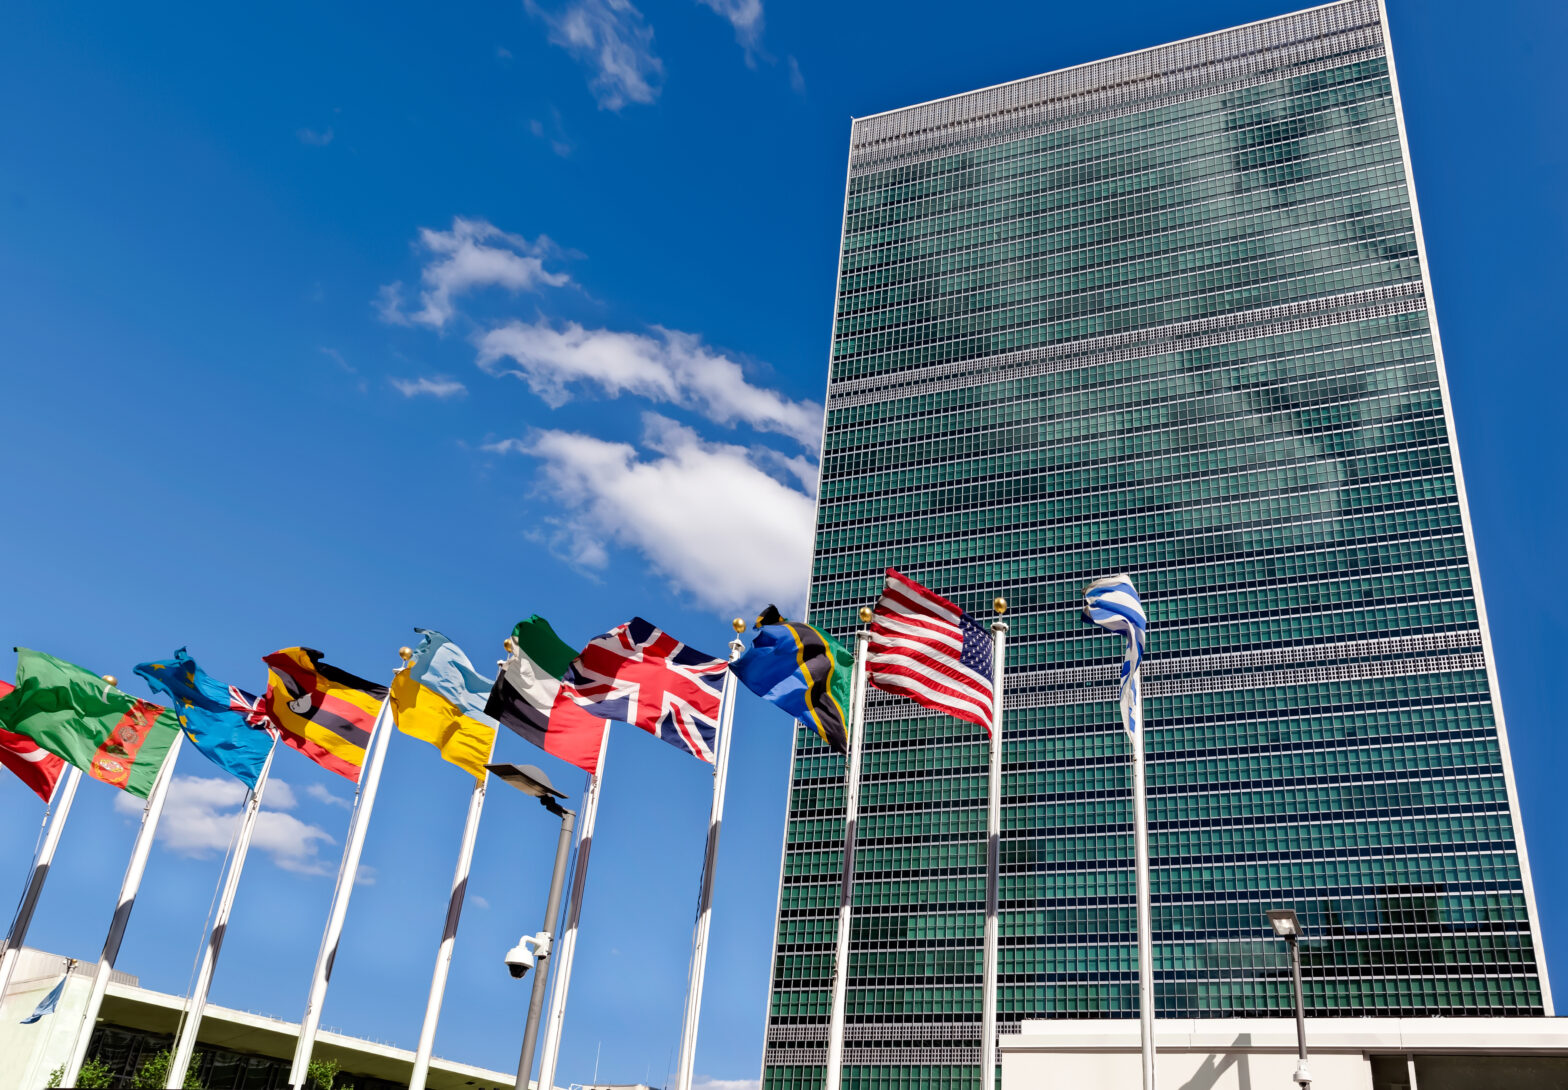
The UN has teamed up Qlik and its visual analytics platform to create apps that analyse the mass-amount of data available to the United Nations, such as gender statistics and the UN Comtrade.
The aim of this collaboration is to put data at the front of changing outcomes for governments, regions and people in need.
Understanding data is key
It will help accelerate access to actionable information for diplomacy and humanitarian relief missions.
This is part of Qlik’s Corporate Social Responsibility “Change Our World” platform, which provides software to humanitarian organisations, such as the UN and Medair, to make better sense of complex information.
The United Nations, through the Office of Information and Communications Technology (OICT), is leveraging Qlik’s visual analytics platform to create applications advancing United Nations’ missions by aggregating and presenting information in an easy-to-use way that provides valuable insights for prompt action.
>See also: The world’s first drone delivery service
This partnership encapsulates Ban Ki-moon’s, the United Nation’s Secretary-General, recent remarks at Davos:
“I call Agenda 2030 our ‘declaration of interdependence.’ The world is coming to recognise more and more that problems in one country reverberate in another.”
“A crash in one market can drive a crisis around the world. That is why it is so important to make the most of our collective strengths. We will need to work together – across sectors and industries – to address how to realise new approaches to finance, investment, trade and technology.”
Through the efforts of OICT, the UN aims to support the analysis of the Sustainable Development Goals by presenting indicators from the massive amounts of data available to them to identify and track improvements to barriers to population wellbeing.
Case studies where data can be turned into action
The Data Portal for Minimum Set of Gender Indicators presents key gender statistics from fields including education, labor market, and health, which are particularly important for measuring differences in the social and economic situations between women and men.
Gender statistics seek to identify, produce, and disseminate data reflecting the realities of the lives of women and men, and policy issues relating to gender equality.
The app was launched by the Department of Economic and Social Affairs at the 6th Global Forum on Gender Statistics in Helsinki, Finland. The forum is attended by many governments from around the world and UN agencies working on gender issues.
The UN Comtrade analytics app, designed by the UN Statistics Division, contains interactive visualisations of downloadable time-series data that reflect the very latest trade data available in UN Comtrade.
In addition, the data gaps were estimated and flagged accordingly. Countries’ export and import data are displayed in a world map that is colour-coded by trade intensity and visualisations of trade balances, top trading partners, top traded commodities, and more.
It can be further customised by selecting individual or multiple countries, regions and/or commodities, and time periods.
“The power of what we do is not about the data, it is what data does for people,” said Lars Björk, CEO at Qlik.
“It’s exciting to see the UN’s vision for not just how they can leverage all of their data best, but how they can make some of that data available to citizens of the world for their own understanding.”
The power of data is strong and unlocking data-driven possibilities through visual analytics will have transformative global effects.


