Find out how to the right platform could empower decision-making and improve business outcomes
If data is the new oil, then analytics platforms are the refineries—turning masses of raw data into vital, usable, actionable insights, without the need for you to have extensive digital literacy or coding skills.
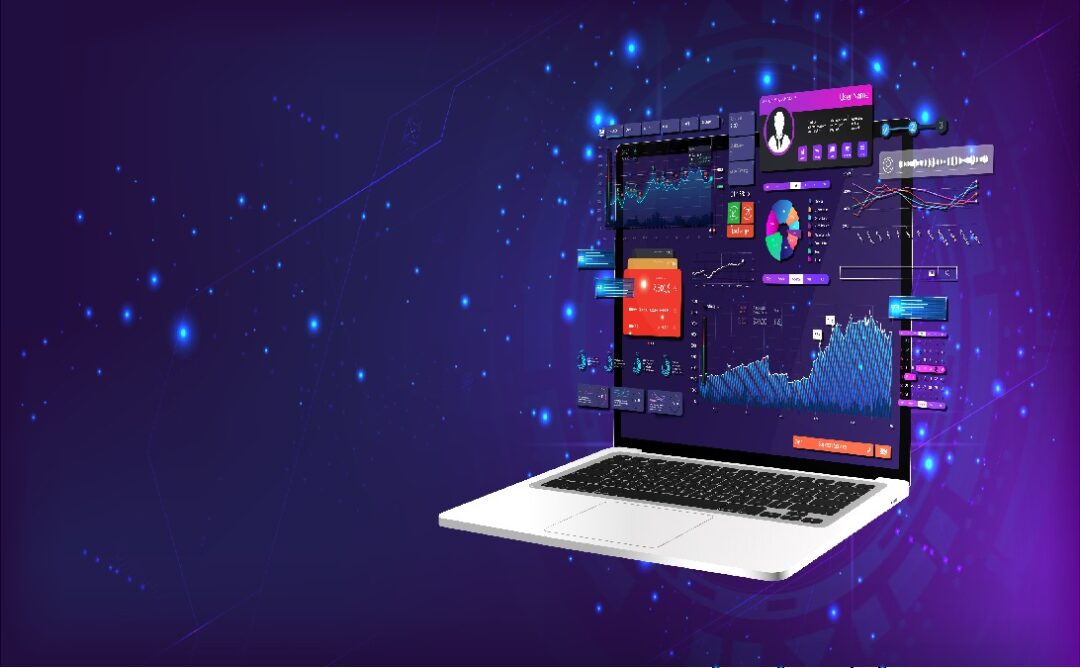
So, if you want to get the most out of your data, you’re going to need a modern self-service business intelligence (BI) & analytics platform; one that allows you to integrate multiple sources, create compelling reports and visuals, and automatically surface transformational trends and anomalies.
Previously, BI tended to focus on historical data and diagnostics, telling you what’s already happened and how to fix it. However, a new generation of analytics platform is going much further, by predicting likely outcomes and influencing proactive actions.
BI software has been shown to boost productivity by 40 per cent, increase revenue by 33 per cent, and increase ROI by 35 per cent—but to maximise its potential, you need to fully understand its capabilities and how they can function within your organisation.
Below, we explore the key attributes of Zoho’s modern self-service BI & analytics platform, and explain how you can use it to empower decision-making and improve business outcomes.
Data integration
Integrating multiple data sources into unified sets is key to building a comprehensive picture of your organisation, from which you can confidently make operational decisions.
Using connectors, you can import and blend data from files and feeds, local and cloud databases, your warehouses, and countless business apps. This data can then be viewed on tailored dashboards, which combine graphs and key insights in an easy-to-understand grid format that can give you an instant snapshot of the various aspects of your business, such as sales, marketing, finance, and much more.
In-line data preparation and management capabilities
Self-service, in-line data preparation allows you to transform your raw data into a usable format, with the ability to integrate, model, clean, enrich, catalogue, and organise masses of information and prepare it for analysis.
Auto modeling identifies data types and suggests how different datasets can be combined, while smart cleansing automatically improves data quality by filtering out duplicates and invalid entries. Data can then be transformed by over 250 functions and enriched through sentiment analysis, keyword extraction, and language detection.
When your data is fully prepared, it’s easy to manage with categorisation and custom tags, and you can conduct instant system-wide searches using the smart AI assistant.
Augmented analytics
Augmented analytics makes use of the platform’s artificial intelligence (AI) smart assistant to automatically generate valuable insights that would previously have required manual intervention. It combines:
Auto analysis
Auto analysis can deliver insights on anomalies, patterns, and trends, with no need for manual entry. It does this by monitoring operational performance based on your predefined business KPIs. If there are any critical changes or unusual patterns, it can automatically alert you, so you can take quick and decisive action.
Conversational analytics and automated insights
You can use Ask Zia, our AI-powered conversational assistant, to quickly reveal insights and create reports just by asking a question. Zia uses natural language generation (NLG) and natural language querying (NLQ) to interpret your questions and produce the most relevant reports. Not satisfied with the response? You can add qualifiers to your question to generate an even more relevant answer.
Best of all, the more you ask, the more Zia learns. Based on patterns in your queries, it can help you by suggesting personalised follow-up questions and supporting phrases. These can then be used to generate further reports.
What-if analysis
What if this happened or what if that happened? As the name suggests, what-if analysis allows you to create variables and measure differences in outcome. You can use this to assess the business impact of different scenarios ahead of time and plan accordingly.
For example, using sales forecast data, you could measure the difference in projected sales based on the possibility of either a 10% decrease or a 10% increase in discount percentage.
Advanced analytics
Advanced analytics encompasses several powerful analytical tools that can give you invaluable insights into the past, present, and future of your business.
Using a forecasting algorithm, you can access credible predictions on future data trends, based on a deep analysis of your historic data. It might sound complicated, but all you have to do is pick a relevant prebuilt forecasting model, such as ARIMA, regression, etc., set up a forecast in a chart, and customise the number of units, the number of past data points to be ignored, and the formatting to be applied over the data points. These predictions can then be visualised in a number of simple chart types.
And you can even use trend lines to identify and plot past and future trends in your time series or number series data. Depending on your preference, you can choose to derive the trend line by applying a number of models, including linear, logarithmic, and exponential.
All of this gives you a comprehensive picture of where your business is at and where it’s (probably) going, allowing you to make informed decisions on the best course of action.
Data storytelling
Data storytelling can help to reduce the time and effort required to comb through data and pull out insights by presenting it in a compelling and digestible format.
Rather than relying on tedious manual interpretation of charts, immersive presentations and textual narration of reports and dashboards can help you reach valuable conclusions about your data much more quickly.
Presentations combine colorful visualisations, text, infographics, video, and other factual aids in a slideshow format, which you can show to your team in Big Screen mode and create a permalink for having them shared.
Zia Insights relies on natural language generation to turn visual reports into digestible narrations for easy consumption of insights. You can customise insights into three levels of narration (low, medium, and high) depending on how complex you need the insights to be.
Deployment models
Zoho gives you the flexibility to deploy its analytics platform in a number of ways, depending on your needs.
With Zoho Cloud, for a monthly subscription, you can access the full range of BI & analytics functions through a browser or mobile app. Or, if you want to bring your data analysis in-house, you can install Zoho Analytics on your own servers or on private clouds. White-labelled versions are available for both cloud and on-premise, meaning you can offer your own branded analytics service, either as a standalone portal or embedded within your own app.
Alternatively, you can deploy the platform on a number of public clouds, including AWS, Google Cloud, and Microsoft Azure.
Other capabilities
The above details some of the platform’s most advanced and unique BI and analytics functions, but Zoho Analytics offers plenty of other capabilities that can help to optimise your operations.
Firstly, it comes with hundreds of prebuilt analytics, so you can hit the ground running, with a comprehensive overview of key business metrics via powerful dashboards. When you’re ready, you can build your own ad hoc reports and dashboards for a more personalised view of your operations.
All these reports and dashboards can then be shared with, and commented on, by relevant colleagues, maximising opportunities for collaboration and giving everyone a universal view of essential business data. And with embedded analytics, each user can access data within their preferred application rather than having to constantly toggle.
But that doesn’t mean everyone has access to everything all at once. You can decide what individual colleagues and clients can see and their level of control, like read-only, read-write, and report authoring.
Final thoughts
Whatever size your business, and whether you need to transform your sales, marketing, finance, HR, or any functions, BI & analytics gives you the tools to crunch the data, discover vital insights, optimise operations and, ultimately, fuel growth.
Recognised by leading industry analysts, Zoho Analytics is already used by thousands of businesses around the world to analyse data and empower decision-making.
Find out more about Zoho’s modern self-service BI & analytics platform and learn how it can benefit your organisation.
Related:
Data science and AI: drivers and successes across industry — Heather Dawe, UK head of data at UST UK Data Practice, discusses how data science and artificial intelligence (AI) are driving digital transformation success across sectors.
The role of data analytics in Fintech — This article will explore the role of data analytics in Fintech operations, as the disruptive innovation space continues to grow.