Every type of database is a metaphor for the arrangement of information.
The earliest mainframe databases arranged their contents in a simple, tree-like hierarchy. This had a number of drawbacks, though: it was highly repetitive and laborious to update.
Over time, this hierarchical approach was entirely replaced by the relational model. This splits the data into tables, and links items in those tables together according to ‘relations’.
The relational data model has dominated database management systems for more than thirty years. It has proved a powerful platform for business applications and has spawned, in the form of SQL, a standard language for querying databases.
But as digitisation has progressed, spitting up ever more kinds of data, demand for alternatives to the relational model has grown.
Database systems such as MongoDB and MarkLogic store data simply as a collection of documents, making search more efficient and powerful. There are a number of non-relational databases for the Hadoop platform, such as Hive and HBase, that allow users to query distributed data in a SQL-like fashion.
See also: Understanding the maturing role of graph databases in the enterprise
Another kind of non-relational database, which proponents claim is poised for a major revival, is a “graph database”.
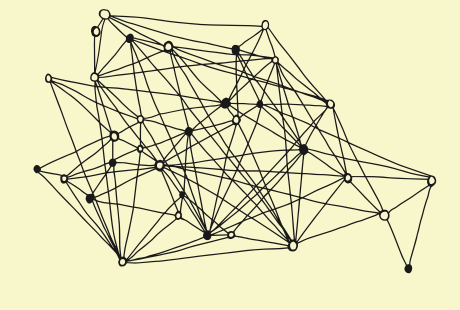
In mathematics, the term ‘graph’ means a network of objects, some of which are connected by links. In a graph database, each node of the network represents some item of data – a name, or an address, or a number etc. – and the links, or ‘edges’, denote a meaningful connection between two nodes.
What this means is that the links between data can be easily accessed and analysed.
The idea is not new. When IBM researcher E. F. Cobb first proposed the relational model back in 1970, he argued that it “appears to be superior in several respects to the graph or network model presently in vogue”.
But the web has spawned a number of new use cases for the technology.
"A graph model allows you to discover which products always sell together"
Jim Webber
Neo Technology
Twitter, for example, has developed its own graph database software, called FlockDB, to represent the links between its members.
“Twitter uses FlockDB to store social graphs (who follows whom, who blocks whom),” the FlockDB’s project page says. “As of April 2010, the Twitter FlockDB cluster stores 13+ billion edges and sustains peak traffic of 20,000 writes per second and 100,000 reads per second.”
Other web giants representing data as graphs include Facebook, whose “social graph” maps the interconnections between users, and Google, whose “knowledge graph” describes the semantic links between people, places and objects.
Commercial applications
One of the few companies selling a graph database platform commercially is Neo Technology.
Back in 2000, the company’s co-founders were building a new interface for a content management system (CMS). They wanted to use the connections between content stored in the CMS to help users find the information they needed, but they found that the relational database they were using did not make this at all easy.
“They realised that the [CMS] software was managing not just a lot of individual, isolated and discrete data items, but the connections between them,” explains Jim Webber, Neo Technology’s chief scientist.
“That connected data was more challenging to store in a relational table and tremendously slow to query.
“They sensed that, armed with a graph data model, our development team might not waste half its time fighting the database,” Webber says. “A few years later they found they could remove the underlying database, and created the world’s first modern graph database.”
An open source community version of that database, called Neo4J, was released in 2007, under an open source licence. Neo Technology also sells a commercial version, providing support and services to its paying customers.
Graph databases may be most commonly associated with social networks, but Webber says companies used Neo4J to analyse patterns in datasets ranging from telecommunications networks to genes and proteins.
And there are many more mainstream applications to come, he adds.
“In a retail situation, a graph model allows you to discover the relationship between which products in a basket always sell together,” Webber says. “This enables you to uncover patterns, so you can co-market products together.”
Analyst company Gartner has identified a number broad use cases in which graph databases offer “a sustainable competitive advantage”, including social media analysis, mobile data analysis and intent analysis.
But there are limitations, it says. Firstly, as with any emerging technology, conventional IT departments may struggle to find the skills required to deploy a graph database.
More specifically, there are currently scalability problems with most graph databases, according to Gartner analyst Nick Heudecker.
“Graph databases may be ideal for social network analysis if the nodes are generally fairly well balanced,” he explains. “But if you have one ‘supernode’ with many edges, for instance a celebrity on Twitter with many followers, it becomes challenging to scale that database.”
Neo’s Webber concedes that scalability is an issue in graph databases. Much like relational databases, it is difficult to split them up into parts and distributed them across numerous machines.
“One of the difficult things about graphs is that they’re quite difficult to partition,” Webber explains. “If you have connections between nodes on different machines, you have to hop between those machines for a typical query, which is far slower than if you traversed the graph within a local [machine].”
Some graph database providers claim to have solved this problem. US start-up Aurelius, for example, claims that its Titan graph database is “optimised for storing and querying graphs containing hundreds of billions of vertices and edges distributed across a multi-machine cluster”.
Titan was launched in September last year. Aurelius has also launched a graph analytics engine, called Faunus, which works with Titan and the Hadoop file system.
Neo Technology’s Webber predicts that the graph database market is poised to blossom with innovation. “At some point, 10 years from now, we will be just one player in a vibrant analytics and data ecosystem around graphs.”
He believes that as awareness grows, adoption will follow. “Once it becomes well known that graphs are easier, more convenient and faster, we will reach a tipping point with more and more people embracing them, outside of blue chip companies,” he says.
Just because they are a niche today, does not mean that graph database will not dominate in future, Webber adds.
“Three decades ago relational databases were confined to a few niche markets,” he says. “But they grew and eclipsed absolutely everything else that went before them.”


