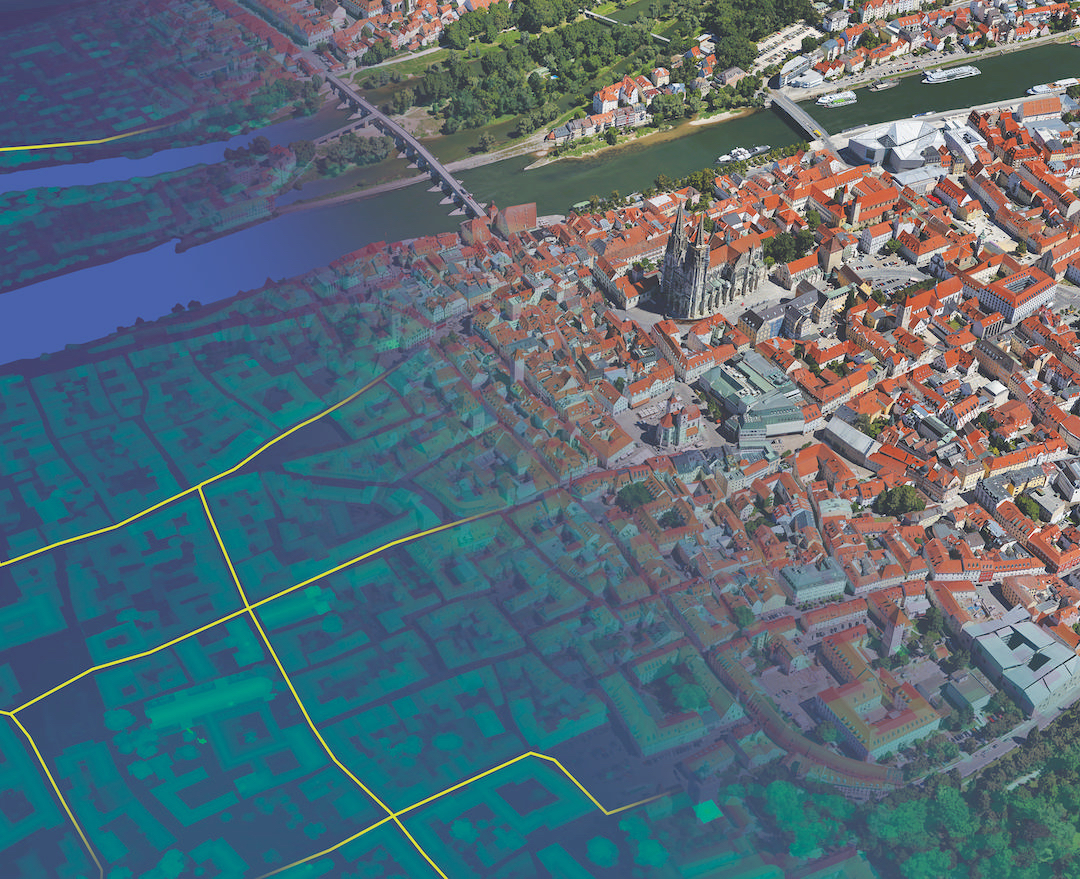
Big data visualisation
Suppose you own a huge gold mine but cannot use its end-product. Then, what’s the use of being an owner of a gold mine? With big data, the situation is similar. Experts are of the opinion that there’s no use in gathering huge amounts of data if you cannot utilise the information that lies beneath.
To resolve this issue, the key weapons that one needs are data visualisation tools. Such tools offer you different insights into the collected data. The big shot companies like Microsoft and Google collect data and manipulate it to shape the future of the business techniques. If you wish to know about the tools for visualisation of big data that everyone should use, read on.
1. Google Chart
One of the most obvious benchmarks is Google because it is acclaimed for the extreme user-friendliness that is provided by its products and services and Google Chart isn’t any exception.
>See also: The top five data trends coming in 2018
It goes without saying that it is definitely the simplest tool that you can use for the purpose of visualising sets of big data. There is an extensive collection of chart gallery in Google Chart, from a line graph to hierarchical structure which can fit in with any requirement. If you wish to dig in deep, you can even seek some sort of technical help.
2. D3
Data driven document or D3 is a JavaScript library that is utilised for visualising big data in any way you would want to. Rather than being a tool, the user of this should have good knowledge of JavaScript to offer a shape to the collected data. The data that’s manipulated are rendered via SVG, HTML, CSS and old browsers just don’t get a place here. D3 is immensely fast and it supports real-time data sets.
3. Tableau
Tableau desktop, yet another really good data visualisation tool for handling big data and this is available to all. Two different variants are Tableau Online, which is cloud-based, and Tableau Server.
>See also: Big data and the legal community
Both of them are designed for organisations related to big data. No, you don’t require being a coder in order to use the tool as it is extremely handy and it offers lightning speed. One more thing which is positive about this tool is that the canvas can be deemed as user-friendly as well and is compatible with the drag and drop feature.
4. Highcharts
This is a charting library which is created purely via JavaScript and therefore you need a little bit of knowledge on JavaScript for implementing such a tool.
Highcharts uses SVG, HTML5 and VML for showing charts through different browsers and iPhone and Android devices. This tool needs 2 .js files for any specific execution and these are usually available on the normal web pages.
Highcharts is effective enough to provide real-time JSON data, which represents this as per a chart that is mentioned by the user.
>See also: Data with personality: the evolution of visualisation
5. Datawrapper
This is one of those data visualization tools that have gained momentum very soon, especially amidst those media companies that utilize it for designing charts and presenting statistics. This tool has an easy navigation process where you can upload a .csv file to design charts, maps, visualisations and many more.
Every single bit of data has a story tied to it, and data visualisation tools are the only way of listening to the story, which each byte tries to convey. They even help businesses in understanding the future trends and present statistics of the market.


