As the Covid-19 pandemic caused significant impact across the world, the supply chain industry in the UK was not alone in seeing the dynamics of its business change rapidly.
In the early stages of the crisis, as the general public faced lockdown, the manufacturing industry found itself in steep decline, with many plants shutting their doors, while the grocery and healthcare supply chains faced unprecedented demand and huge growth in volumes.
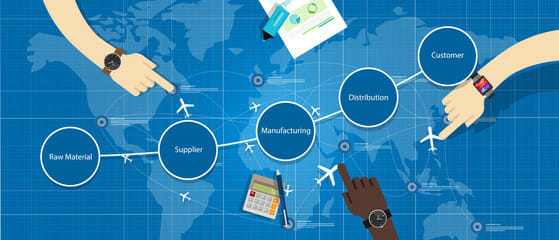
In normal times it’s important to have oversight and visibility of the supply chain across industries, but the rapid and simultaneous nature of these changes highlights just how critical this is.
While many supply chain management software systems exist, the pandemic highlighted the strength of data visualisation, and in this case the need for a data visualisation tool that could bring together huge amounts of information from across many sectors, covering everything from human resources to physical assets, in order to support the decision making process.
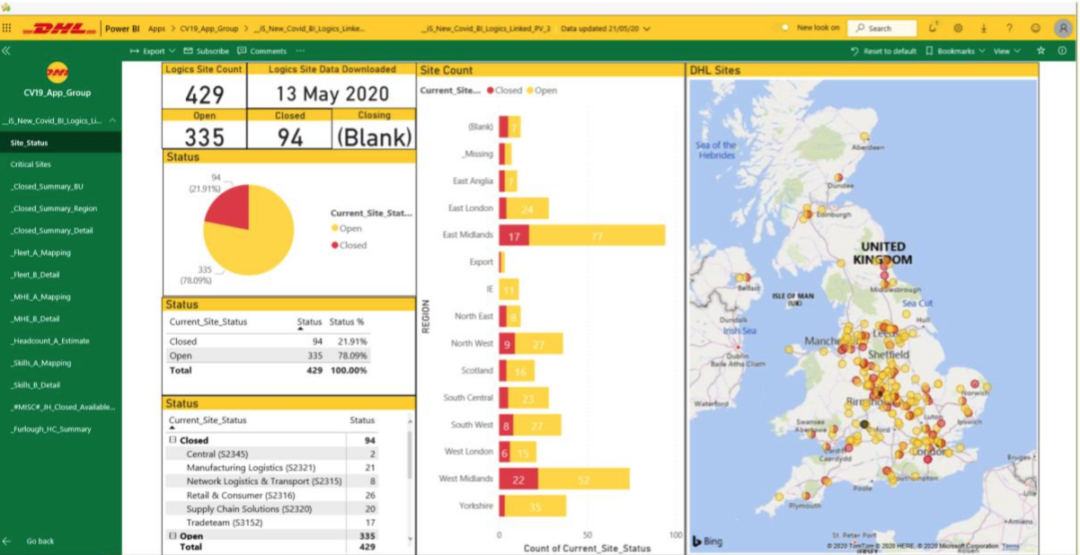
In the first weeks of crisis response the DHL Supply Chain team set out to quickly design something that did just this, providing oversight at both a national and regional level, and enabling those managing supply chains to quickly and efficiently redeploy resources to support the evolving needs of the business. While the tool itself was designed to fulfil a particular purpose, it has potential applications beyond these circumstances, and the learnings provide useful insight for those working with data and systems design in other applications.
1. Identify business priorities to ensure relevance
In the early stage of the pandemic response it became clear that there were several critical areas of business that needed to be prioritised, including the replenishment of stock for grocery and convenience retailers. Likewise, as restrictions were imposed, several operations began to shut down. As a result, our customers and employees needed us to understand the opportunities for the redeployment of resources in order to support these fluctuations.
To do this successfully, the team working on the development of the tool needed to be plugged in to the wider business to understand where volumes were a challenge, the location and availability of resources, and importantly understand the skills available.
This allowed us to design a tool that provided the correct level of analysis and insight, and produced the data needed to help those managing the redeployment. As the tool evolves it’ll be important to continue regular communication with the end user to ensure it remains relevant to their needs. For example, as new regions start using it their unique requirements will need to be considered and catered for.
The secret to supply chain visibility woes
2. Design with the end user in mind
The downfall of a new system can often be its complexity or the expectation of a certain level of prior knowledge. As we knew that users of the tool would come from different backgrounds and wouldn’t necessarily have the same level of IT or supply chain knowledge, it was imperative that the resulting data could be articulated simply and in layman’s terms.
Fundamentally the output of the tool needed to be understood by people outside the business and with no previous supply chain understanding. To achieve this, we integrated geographical mapping into the system, as presenting data in a visual way can be a useful way to simplify complex data.
For teams looking to introduce new tools and systems in the future it really is essential to consider the end user and the end use at every stage of the design process to ensure its fit for purpose.
3. Success is a journey, not a destination
Our prototype was created in less than ten days, but is already being considered for global rollout, and as this happens, the specific requirements of the tool will change and broaden. At the beginning of our process, the tool only offered a top-line overview, looking at vehicle type and warehouse or transport workers. Very quickly we realised we needed to provide more detail, and so integrated information on the skill levels of each individual across the business, as well as equipment type.
As we continue to build and develop the tool, we anticipate additional levels of data will be added to accommodate the specific needs of each region and business unit. Looking to the future we also see the potential for a degree of predictive analytics to be built in.
Ultimately, the long-term value of a tool like this is undeniable, but it will only be maximised if the teams managing them keep one eye on the future needs and strive to continuously improve functionality.
While our mapping tool was pulled together as part of our business’ response to the Covid-19 crisis, it has already shown itself to have potential value far beyond this event thanks to the work of the responsive and collaborative team driving it forward.
Any new model or tool needs to be relevant and responsive to the needs of the end user and keeping this in mind will ensure success regardless of how short the delivery timelines are.