It’s no secret that it’s harder than ever to get on the property ladder in the UK, but there has yet to be a full, digestible breakdown of house prices beyond a generic nationwide overview.
Fortunately, analytics firm Briskat has sought to change that by churning through the 20 million house sales that the government has recorded since 1995 – and presenting them in a live interactive dashboard.
Not all property transactions are recorded, but the UK government publishes more than a third of those in England and Wales every month, with total sales equaling £3.26 trillion in the past 20 years.
The average UK salary today is £25,000, 87% more than in 1995 when it was £13,400. However, in the same amount of time, the average house price has increased by 335% – from £60,000 to £261,000.

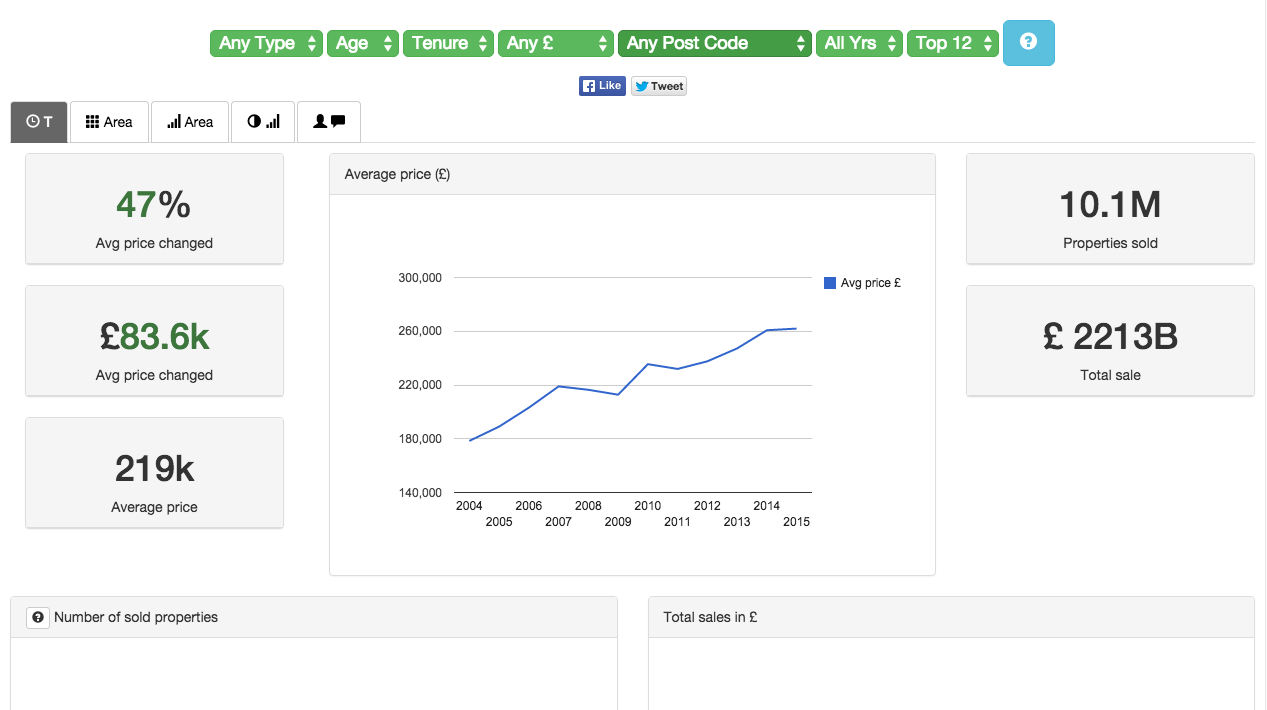
Average house price in the UK (1995-2015)
‘Buying a property of an average price in 1995 took five annual gross incomes while now it takes ten,’ says Vladimir Makovsky, co-founder and CEO at Briskat. ‘If we took the median price, it would be four incomes in 1995 and eight in 2015.’
Overall, the average UK house price has grown every year since 1995, with the exception of 2008 when it dropped by 1%, and 2009 and 2011 when it dropped by 2%. The highest increase was 15% in 2004.
But the most interesting figures in Briskat’s live dashboard come through the ability to filter by postal code.
For example, the average house price in Durham has increased at half the national average since 1995 – just 168% – and has fluctuated around the current value since 2006.

Average house price in Durham (1995-2015)
To no surprise, London has experienced the highest growth, and its postcodes make up nine of the top ten locations for increases in average house price.
The biggest winners are homeowners in WC London, who have enjoyed a staggering 515% increase in average house price since 1995 – reaching £1.06 million in 2014, but dipping 16% to £884,000 this year.
‘West London took the first place in June with 531% increase with the average price of £1.01 million,’ Makovsky adds.
But there has been plenty of growth outside of London, too. Brighton flats now sell at an average of £219,000 compared to £40,000 in 1995 – growth of 444% – while Cornwall favourite Truro has enjoyed 380% growth, from £42,000 in 1995 to £203,000 in 2015.
According to Makovsky, while Briskat’s dashboard does present the painful reality that buying a property in the UK is on average two times less affordable than it was 20 years ago, it also shows that it remains a safe investment.
‘The property prices grew up higher than the inflation,’ he says. ‘The growth is not so surprising when we consider England is already the second most crowded major country in the EU.
‘The population grew by more than 10% in the last 20 years. Based on the presumption the population growth is expected to continue, a significant price decrease is implausible in the coming years.’

Average house price in WC London (1995-2015)
Click here to view how the average house price in your postcode has fared over the past 20 years.


