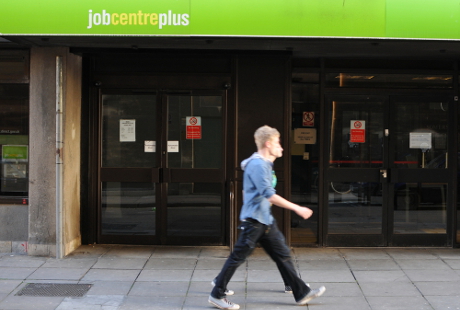
Unemployment in the UK is in decline, according to the latest figures from the Office of National Statistics. Between May and June this year, the unemployment fell by 0.1 percentage points to 7.7%, compared to the previous three months.
But for young people, the situation is much worse. Of those 16 to 24 year olds not in education, 21% are unemployed, the ONS found. This shows how the under 25s can bear the brunt of an economic downturn, and illustrates the need for support to help young people get into work.
One organisation providing that support is the Medway Youth Trust. The Medway region, in Kent, has seen a steady rise in unemployment since the close of the Chatham navy dockyard in the 1980s.
MYT provides advice and guidance to young people in area to help through education and into work. One of it key responsibilities is identifying young people who are at risk of becoming ‘NEETs’, standing for ‘not in employment, education or training’.
To do that, the charity uses data analytics.
Back in 2008, the organisation implemented SPSS, the statistical analytics application that has since been acquired by IBM.
It uses the software to analyse structured data such as educational records, to build a statistical model that could predict the likelihood of a young person falling into unemployment after leaving education.
It also uses the text analytics capabilities of SPSS to analyse the notes made by advisors during their meetings with clients, which are entered into a CRM application. This helps it spot things the client might have said that could be a predictor for unemployment.
“We worked with drug and alcohol professionals and found out what the buzzwords were at the time,” says Gary Seaman, head of business analytics for Medway Youth Trust. “So, for instance, if a young person mentions ‘skunk’ we’d flag them as a drug risk. If they say “sofa surfing” then they might be at risk of homelessness.”
“We were able to join the free text with the structured demographic data for a 360 degree view of a young person, allowing for early intervention.”
That helps the charity focus its resources on the most at-risk clients. “As a small charity we are stretched very thinly in terms of resources,” says Seaman. “A 30% cut in our funding 18 months ago means we can’t help all the young people we were helping before, but this system allows us to identify those that need our help the most.”
Resolving anomalies
But the combination of the text analytics and the numerical analysis was not perfect, and Seaman began to notice certain anomalies.
“We would sometimes get a propensity for a young person to become unemployed in a certain month, for no obvious reason,” he recalls. “Or you would get cases where a young person is telling one of our advisors he’s happy in his job delivering pizzas, but in our structured data we might find he’s actually unemployed.
“We needed to deal with data quality issues which were affecting our targets,” Seaman says. “I got interested in drilling down to the individual level and finding out why that was happening.”
Earlier this year, Seaman began experimenting with Tableau Software’s visual business intelligence application, as a replacement for the Excel spreadsheet it uses to present the findings of its statistical analysis.
This provides a much more accessible view of the risk profiles by giving each client a ‘red, green or amber’ rating. “The visual effectiveness of Tableau allows our staff and management team to make proactive, knowledge based decisions to effect a successful intervention in a young person’s life,” explains Seaman.
By overlaying the risk profiles onto a map, the charity can also identify schools and neighbourhoods that present a particular problem. “The traffic light system enables us to identify where our Advisers are needed the most, by identifying particular geographical areas or even particular schools”.
Last year, MYT won analyst company a Business Intelligence Excellence award from analyst company Gartner.
“What got us the vote was our use of text analytics,” says Seaman. “When I went to the awards event, I spoke to a lot of people working for commercial organisations who all said “we should be doing this now.”
“I naively had thought that they already were,” he says. “Now it’s starting to take off in commercial applications and everyone’s talking about big data and social media analytics, what insight you can get from unstructured data.”


