Waste. If there’s one thing every businessperson can agree on, it’s that waste is bad. It’s created by inefficient, poorly designed business processes and takes many forms — hours spent doing something that should be easy, frustrated customers and employees, needless admin hurdles, unnecessary cost leakage. It’s a long list.
And, of course, waste hurts. It uses up resources that could be better spent on other things, squanders people’s time, and ultimately impacts on your bottom line.
If only there were an easy way to find wastage and broken processes and track improvements as you fix them. There is, and it’s all about big data and business intelligence.
“Inefficiencies cost many organisations as much as 20 to 30 percent of their revenue each year,” writes consultant Marina Martin in Business Efficiency for Dummies. “Imagine what your company could do it if had 20% extra funds to funnel into customer acquisition or research and development.”
What is a business process?
A business process is essentially any function your business performs regularly that takes an input of some kind, makes a change to it, and provides an output. Examples of business processes could be:
● Manufacturing a product.
● Customer service operations.
● Recording expenses.
● Making payroll.
● Onboarding a client.
Data analytics + business intelligence = reduced waste
Big data is a vast, fascinating field that can shed light on almost every aspect of an organisation or industry. Gathering data from your business processes and analysing it can start to unearth some surprising insights. You can then use these insights to create process improvements, increase efficiency, reduce waste, and enhance profits.
>See also: Could the IoT in manufacturing tackle the global problem of food waste?
When it comes to process improvement and big data, it’s all about:
1. Defining exactly what you need to measure.
2. Accurately measuring what’s going on at every stage of a business process.
3. Analysing the data and seeing what it tells you.
4. Using that analysis to inform process improvement.
5. Putting improvements in place and measuring again.
6. Having a “warning” system that highlights any future process inefficiency.
If you do this well, data analysis can help to significantly reduce or completely eliminate wastage in your business processes.
Defining what you’re going to measure
If you want to make the most use of your data and arrive at useful insights, you have to measure the right thing. Long before you start delving into datasets, you need to define the areas and measurements that matter.
1. Decide exactly what business process you want to measure, and, if it’s a big process, what parts.
2. Map the business process out so you understand it stage by stage.
3. At each stage, create a list of measurements based on:
● The type of measurement you need — will it be time taken, number of failures, amount of rework, or something else?
● Whether the measure accurately reflects that part of the business process.
● Whether the data gives you insight into how well (or poorly) that part of the process is performing.
● Whether you can analyse and act on the data.
In many cases you’ll want to base your measurements around your existing key performance indicators (KPIs), as that will lead to the most insightful business intelligence.
It’s also critical to take integrate the views and priorities of your stakeholders, and get them on board. “No matter the application of your BI tool, the most insightful business requirements will come from the stakeholders of the reports,” writes Eran Levy from business intelligence software company Sisense.
“While in a smaller organisation this might be just a few people, within larger enterprise deployment there might be dozens or hundreds of dashboard consumers, analysts and others involved.”
Getting viewpoints and feedback from your stakeholders will help you focus on the right parts of the process to measure, and consequently improve.
What’s more, self-service business intelligence software like Sisense can help a great deal to keep line-of- business stakeholders aligned with process efficiency optimisation efforts.
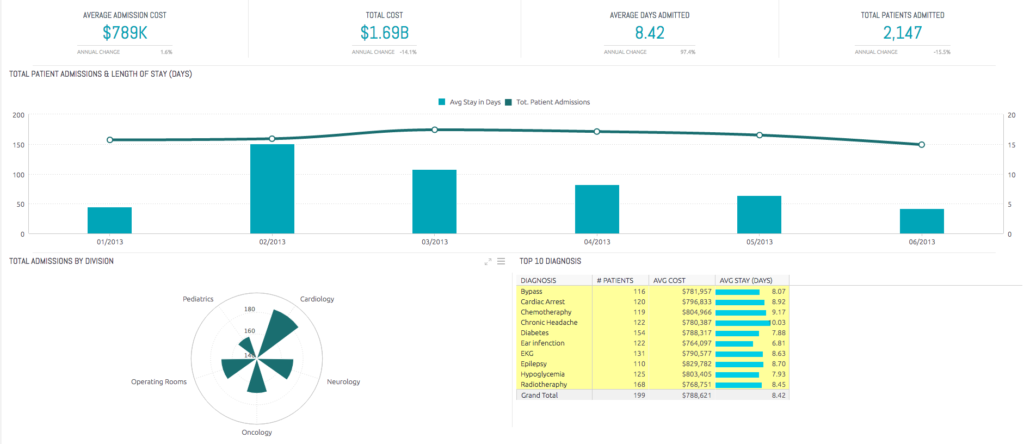
Below is an example of a Sisense-powered dashboard displaying data relating to health care operations. At a glance, a manager can see an intuitively visualised layout of all the important metrics required to ensure all high-level processes are functioning optimally on an ongoing basis.
Getting the right measurements in place
Once you know what you want to measure, it’s time to set these measurements into motion. Ideally, you want to automate measurements as much as possible to avoid natural human error. Think about each specific metric you want, and decide how you’re going to get it.
For information heavy processes, it might be querying a database field; for industrial manufacturing, it could be sensors on the machines themselves. It’s all about gathering data in a way that suits your analysis needs.
>See also: The battle for a driverless car network: can all survive?
Once you have a way to measure, start running the business process and gathering information. As data comes in, query and test it to make sure you’re capturing everything accurately, and that the information in your dataset is usable.
(A dataset is just a name for organised information. It’s through “mining” and analysing this information you’ll get insights into how your business functions. Whereas smaller datasets can be analysed in a spreadsheet, for large datasets – like those created when measuring business processes – you need a specialised approach to get the best business intelligence.)
Let the process and data gathering exercise run for as long as you can. The more data you have, the less chance there’ll be a random error, and the higher quality it will be. Once you’ve gathered the data, you’ll have a big dataset. It’s time to carry out some data analytics and get some insight.
Data analysis and insights
This stage is where you turn your measurements into insights and actions. This analysis can take several forms, so here are some suggestions:
● Create a baseline measurement for how your process works normally and see how your data varies from that.
● Create some “perfect” measurements and targets and see how far away your existing process is and how often it fails to meet them.
● Create a set of poor-performing measurements and see how often your process beats them.
● Drill down into individual parts of the process and see if there are any bottlenecks or very inefficient handoffs.
● Look for trends in the process over time and how it performs at different times of the day.
● See how your process performs with different inputs and outputs.
There are hundreds of different ways to analyze a process and the method you choose will depend on exactly what you want to improve. The trick is to try a few different methods and see what provides the best insight.
Generally, the analysis which gives you the most surprising and interesting results is the one that’s going to work best.
Once you’ve found an analysis method that works, you can dig into the data with specialised tools to find anomalies and issues. It’s from these problem areas you’ll create actions to improve your business processes and remove waste.
Putting improvements in place and measuring again
Now you’ve completed your analysis, your measurements have told you what’s wrong and the parts of your process that need fixing. Now it’s time to roll up your sleeves and put improvements in place.
Using your data analysis and business intelligence you can create improvement plans. Some suggestions for improvements include:
● Asking the people who use the processes to see how they can be fixed.
● Looking at handoffs and bottlenecks to understand what’s causing problems.
● Identifying unnecessary delays in the process and seeing how you can speed things up.
● Looking at tools, machinery, or software that’s being used to see if they cause issues.
● Learning about bad outputs or quality issues within the process and where they’re being caused.
>See also: Business process as a service can deliver improved performance too
Once you have a list of issues and fixes you’ll need to prioritise them and get the fixes in place. Setup a project team and make them accountable for improving the broken process. Give them access to all of your datasets and data analysis. Once they’ve made improvements, rerun your measurements to check they’re working.
Warnings and controls to stop the process failing again
Once you’ve made improvements it’s important to get them to stick. One of the best ways to do this is to keep your measurements in place and set targets and boundaries on them. That way, if your process breaches those boundaries, you’ll know there’s a problem straightaway, and you can take steps to fix it.
This is all about getting “continuous improvement” in place, something that Greater Boston Manufacturing Partnership (GBMP) President Bruce Hamilton, an expert in Kaizen and Lean methodologies, has an opinion on. “Continuous improvement is not about the things you do well ‐ that’s work,” he says. “Continuous improvement is about removing the things that get in the way of your work. The headaches, the things that slow you down, that’s what continuous improvement is all about.”
Business process improvement has to start somewhere. Using an approach that incorporates big data, analytics and business intelligence approach is simply the most reliable, proven way to make improvements that last. Once you know what to measure, track it, analyse it, and improve it, you’ll have the right foundations in place to enhance processes throughout your business. Waste can be a thing of the past.


