The rise of digital platforms means that it is now possible for anyone to publish and distribute a “story” to the whole world in an instant. The truth filters we’ve relied upon for centuries — the media, academic institutions — are being marginalised as “part of the liberal elite.”
What this means is even if the truth does manage to get its trousers on (while the lie is halfway around the world), it quickly gets dismissed (in the words of Michael Gove) as an “expert” that everyone’s had enough of.
This new reality is a breeding ground for the misuse of statistics and invoking of “alternative facts”. In the UK, Vote Leave’s referendum claim that UK “sends £350m per week to the EU” is a notorious example.
In the US, Donald Trump heralded a crowd of 1.5 million at his inauguration in Washington (wrong, even according to Fox News). He claims the largest Electoral College majority since Reagan (it wasn’t).
>See also: Seasonal spam: the unwanted email gift that gives and takes
The media points fingers at the likes of Kellyanne Conway, Boris Johnson, and Michael Gove, but the rise of digital media and its associated tools, combined with lazy readership habits have played an equally important part in growing statistical abuse.
Likes and shares are the currency of a lot of mainstream media outlets. They don’t like this, but it has become a necessity for commercial survival.
Equally, generally individuals tend to read the sensational headline rather than the balanced one, rewarding the journalists with clicks and shares and starting the vicious cycle all over again.
Let’s do a test. Which of these headlines are you likely to click on:
- “NHS crisis: 20 hospitals declare black alert as patient safety no longer assured”
- “5% of hospitals declare black alert”
Most people would click the first (a genuine headline from the Guardian from 11 January 2017). But stop a moment: how many hospitals are there in England and Wales? There are almost 500 hospital providers in the NHS.
Is it a crisis that 5% of England and Wales’ hospitals were overstretched on one winter weekend?
People are drawn to the sensational. They’re interested in the controversial statistic, not the complexities or shades of grey contained in the data.
>See also: Big data analytics: confidence in the cloud
So how do you break the cycle? Here’s three ways.
First, learn to interpret data and charts critically. Don’t just accept a statistic; challenge it.
If you see a story in your social media channels citing a data source, follow it up. How credible is it? Is the sample size big enough to draw a real conclusion? Is there a distortion in the way it is reported? Daniel Levitin’s A Field Guide to Lies is an excellent book on this topic.
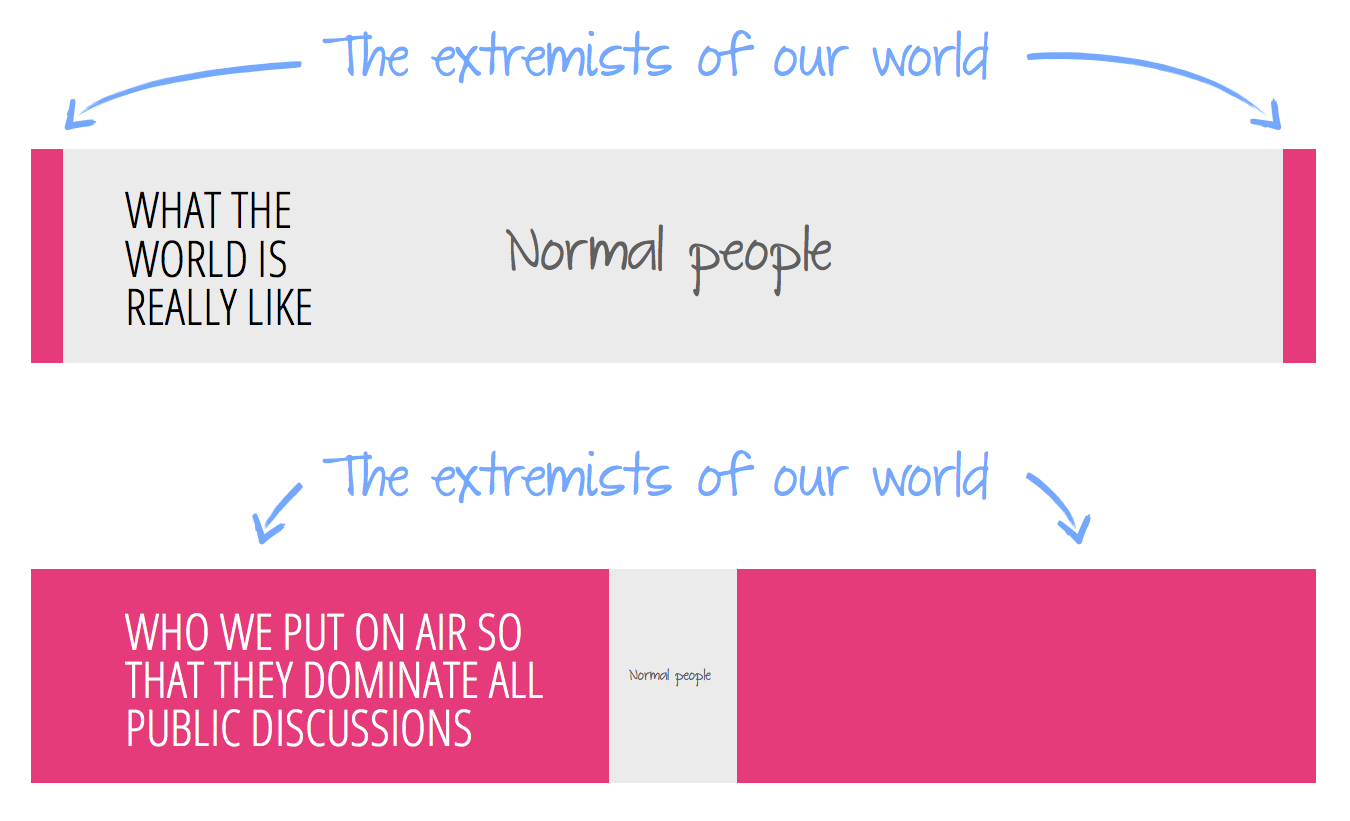
Second, educate your children. Media and politicians can tell very different stories by choosing their data points from the centre or from the extremes. Parents must educate our children to use this knowledge of the distribution as a filter through which to pass information from the media and politicians.
Finally, read two sources of important data stories, one from each side of the debate spectrum. First the Guardian, then the Daily Mail. CNN, then Fox. Don’t slip into lazy media stereotypes or make assumptions. Make it your business to find out which reading of the data you believe is true.
In conclusion, one of the big benefits of big data, visual analytics and IoT is that the lack of, or access to, data won’t be a problem for the next generation.
>See also: What’s the key to big data and AI being successful?
There will be as much data as is needed, and businesses and individuals will be able to summon it, interact with it and use it to make decisions in a matter of seconds – which ultimately, is a good thing.
What the challenge will be, however (and it’s a big one), is establishing the credibility of that data and bringing a healthy scepticism to each piece of information you read.
Sourced by by Andy Cotgreave, technical evangelism director at visual analytics company Tableau and author of forthcoming book ‘Big Book of Dashboards’